
Table of Contents
Let Our Experts Optimize Your Deliveries Today
Let's talkHyperlocal Control Tower
Introducing a single pane of glass for enhanced operational efficiency in Hyperlocal deliveries.
What is Offered?
- A control tower to provide end-to-end visibility, collaboration, exception management and proactive monitoring of orders & drivers.
- Real-time status of Trips and Orders alongside order aging, drivers’ availability and their workload.
- Predictive analysis of multiple attributes to make fast, informed decisions.
- ‘Order booking to Delivery’ panorama view for the store manager
- Customer committed time (CCT) based KPIs.
- View of broadcasted orders & earnings/tips of drivers
Highlights
Get a bird’s-eye view of:
- Trip Summary: Total number of trips, broken down into on-time Trips and delayed trips.
- Own Fleet: Number of Available, Assigned, and In Transit Drivers.
- Outsourced Fleet (Gig Drivers): Number of Available and In Transit Drivers.
- Orders at Risk.
Toggle between Order View and Trip View: Access City & Hub-wise trip/order details by moving the toggle.
- Trip View: Card layout for individual drivers with icons to display GPS signal strength, current location in a map view, capacity utilized, color-coded trip performance status, and more. For every driver, there is an order card that displays several details, including CCT (Customer Commitment Time).
- Order View: Displays milestones for Orders Placed, Ready for Dispatch, Allocation Failed, Assigned, In Transit, Delivered, Delivery Failed, Canceled orders.
How does it work?
- Adjust your view (orders of the last 6 hrs, last 12 hrs, last 24 hrs)
- Map your milestones in the system (order placed, order prepared, delivered, canceled)
- Add your own fleet & gig drivers
- Add your customer commitment window/slot (say 30 mins for food) for the account/hub/order
- Set your default filters
- Set your “at risk” time, which triggers you for a proactive notification.
Slot Performance Dashboard for Analyze platform
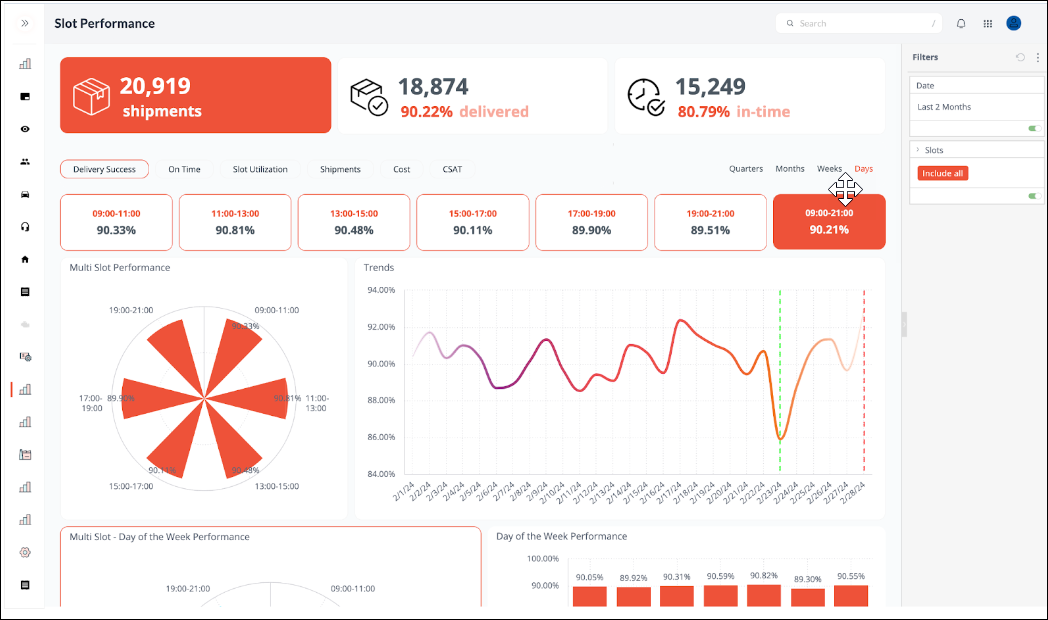
Introducing a comprehensive dashboard addition to the Analyze platform to track high-level information on the key performance indicators and several other metrics under the slot-based order management. This dashboard enables users with data analytics to monitor and manage slots allowing for enhanced operational efficiency.
What is offered?
- Improved Visibility: Gain a comprehensive understanding of slot performance and its impact on overall operations.
- Data-Driven Decision Making: Make informed decisions regarding resource allocation, slot management, and process optimization based on data-driven insights.
- Enhanced Efficiency: Identify and address bottlenecks to improve efficiency and ensure timely deliveries.
- Increased Customer Satisfaction: By optimizing slot performance, businesses can improve delivery times and customer satisfaction.
Highlights
- Overview Metrics: Quickly access overall performance with key metrics such as total shipments, on-time delivery rate, and delivery success rate.
- Time Slot Performance: Analyze performance across different time slots, allowing you to identify peak hours, potential bottlenecks, and opportunities for optimization.
- Multi-Slot Performance: Visualize performance distribution across all slots through an interactive pie chart, enabling easy comparison and identification of top and bottom performers.
- Trends: Track performance trends over time with a detailed graph, highlighting areas of improvement and potential concerns.
- Day of the Week Performance: Understand performance variations across different days of the week, helping you plan and allocate resources effectively.
Enhanced Drivers Rule Book
Routes can now be created with a fixed break time for drivers. The maximum working hours before break time can be predefined in the Driver Rule Book.
Track the Carbon Emissions avoided
A graphical representation of the CO2 emissions reduced through sustainable last-mile delivery efforts, this enhancement provides valuable insight on:
- Net CO2 Emissions Reduction: A prominent display of the total CO2 emissions avoided, clearly differentiating between Type 1 (emissions avoided by using Electric Vehicles) and Type 2 (emissions generated by manufacturing/charging units) emissions.
- Emissions Trend Graph: Track progress over time with a detailed graph illustrating CO2 emissions avoided on a daily, weekly, monthly, or quarterly basis.
- Additional Emissions Data: Gain insights into other emissions, such as CH4, N2O, NOx, and SO2, providing a comprehensive overview of the impact on the environment.
- Green Trips and EV Usage: Easily monitor the percentage of green trips completed and the number of electric vehicles (EVs) utilized in last-mile deliveries, reinforcing your commitment to sustainability.
Now users can:
- Measure and showcase the success of sustainability efforts through tangible data.
- Identify areas for improvement and optimize last-mile delivery operations.
- Track a wider range of emissions to gain a holistic understanding of the environmental footprint.
- Communicate sustainability achievements and challenges to stakeholders with clear and impactful visualizations.